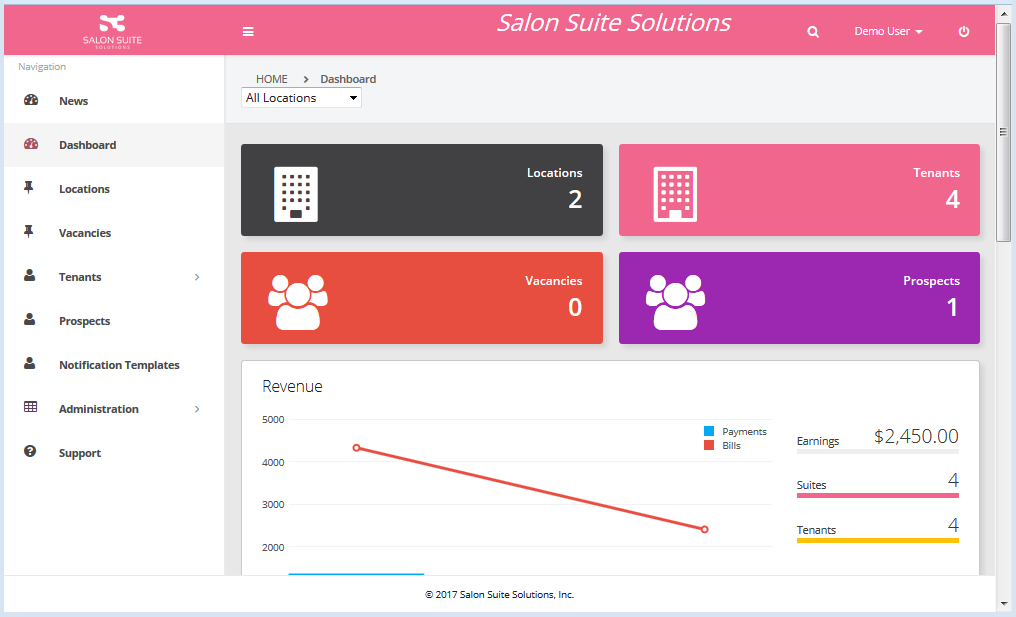
Dashboard
The dashboard displays a summary of the number of locations you have access to, the related Tenants, the number of vacancies, and the number of prospects. Revenue, Overdue Payments, and Visitors Location data is also displayed. The drop down box at the top of the screen can be used to limit the displayed data to a single location.
The Locations, Tenants, Vacancies and Prospects boxes are direct links to the related dashboard pages.

Revenue
The Revenue section displays Payment data from the last year in the graph. Hovering over the graph columns displays the Payment value. The Bill data is depicted in a line graph and hovering over the circles displays the Bill value for that month. Earnings is ??. Hovering over the Suites item displays the Active Suite percentage.
Overdue Payments
The Overdue Payments section displays a list of all overdue payments for the selected Locations. The Full Name field of the overdue payments list can be searched. Enter the name of the Tenant (the full name or just a partial name) and click the Search button. To remove the search criteria delete any text in the search field and click the search button again.
Locations
The Location section displays a map of every location you have access to. A summary of the Revenue by location from the last 12 months is overlayed in the top right corner. The map can be zoomed in and out using the + and - buttons or the scroll button of your mouse.
